
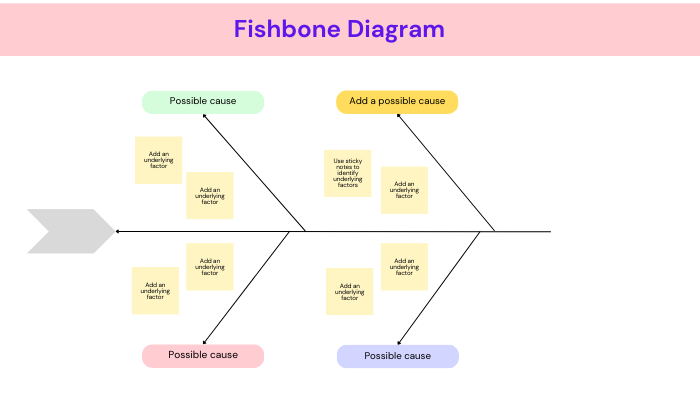
A fishbone diagram, also known as a cause-and-effect diagram or an Ishikawa diagram, is a visual tool used to identify and analyze the potential causes of a problem or an effect. It was developed by Kaoru Ishikawa, a Japanese quality control expert, in the 1960s.
A fishbone diagram is nothing but to examine the causes and effect in a simple manner.
1 Last word proton refers to pharmaceutical online.
2 It’s a chart based diagram to bifurcate all the causes of problem in chart with accurate findings and their solutions.
3 Analyze all the possible causes of problem. You should ask your inner mind why this is happening you can write on a chart.
4 Again analyze about each cause and write their sub cause and try to go deep and deep to each and every level of causes.
5 You should focus on ideas to have solutions.
6 And your should possessive towards the process and not the people.
The main categories typically used in a fishbone diagram are the 6Ms: Manpower, Method, Machine, Material, Measurement, and Mother Nature (environment). These categories cover a wide range of factors that can contribute to a problem or effect.
A valuable tool for problem-solving and analysis. Its visual nature helps to organize and categorize potential causes,.